


Industrial production is up +0.6% m/m, consensus is +0.3% (manufacturing production is up +0.4 m/m, consensus is +0.2%).
Figure 1: CES nonfarm payroll (NFP) employment (bold blue), private sector employment (orange), industrial production (red), personal income excluding current transfers for Ch. 2017$ (bold green), manufacturing and trade sales for Ch. 2017$ (black), consumption for Ch. 2017$ (light blue), monthly GDP for Ch. 2017$ (pink), log GDP (blue bars), all normalized to 2021M11=0. Source: BLS via FRED, Federal Reserve, BEA 2024Q1 3rd Release, S&P Global Market Insights (Former Macroeconomic Advisor, IHS Markit) (7/1/(released in 2024) and author’s calculations.
Normalized to April 2023:
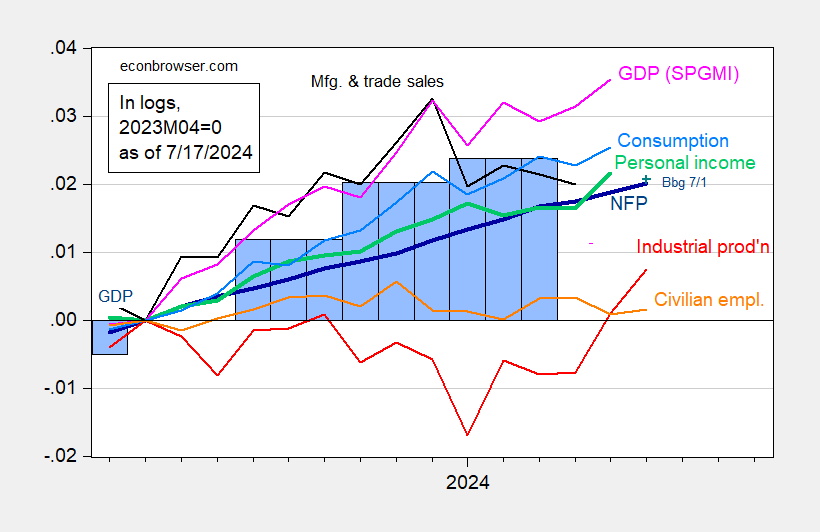
Figure 1: CES nonfarm payroll (NFP) employment (bold blue), private sector employment (orange), industrial production (red), personal income excluding current transfers for Ch. 2017$ (bold green), manufacturing and trade sales for Ch. 2017$ (black), consumption for Ch. 2017$ (light blue), monthly GDP for Ch. 2017$ (pink), log GDP (blue bars), all normalized to 2023M04=0. Source: BLS via FRED, Federal Reserve, BEA 2024Q1 3rd Release, S&P Global Market Insights (Former Macroeconomic Advisor, IHS Markit) (7/1/(released in 2024) and author’s calculations.
Alternative measures of output and employment:
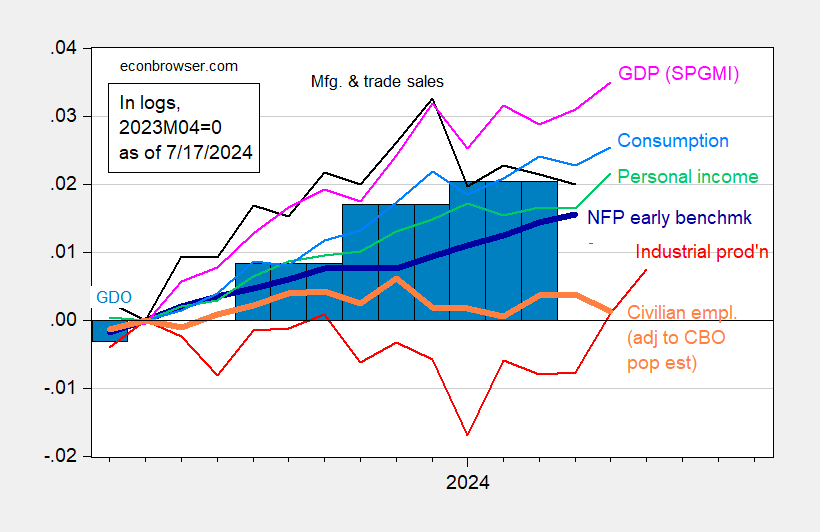
Figure 3: Nonfarm Payrolls (NFP) Employment Philadelphia Fed Initial Benchmark (bold dark blue), CBO Immigration-adjusted Private Employment (orange), Industrial Production (red), Personal Income Excluding Current Transfers in Ch. 2017$ (bold green), Manufacturing and Trade Sales in Ch. 2017$ (black), Consumption in Ch. 2017$ (light blue), Monthly GDP in Ch. 2017$ (pink), GDO (blue bars), all log normalized to 2023M04=0. Source: BLS via FRED, Federal Reserve, BEA 2024Q1 3rd Release, S&P Global Market Insights (Former Macroeconomic Advisor, IHS Markit) (7/1/(released in 2024) and author’s calculations.
GDPNow was revised upward to 2.7% in Q2.


