


at Xthursday:
This is ridiculous. Industrial production and capacity utilization have seen another massive downward revision, and the July print is still negative M/M. Manufacturing is in recession.
Note: Dr. Antoni used industrial production and capacity utilization in the graph above, not manufacturing.
I thought this was an odd feature, so I plotted the data for the same period (using manufacturing instead of industry classification).
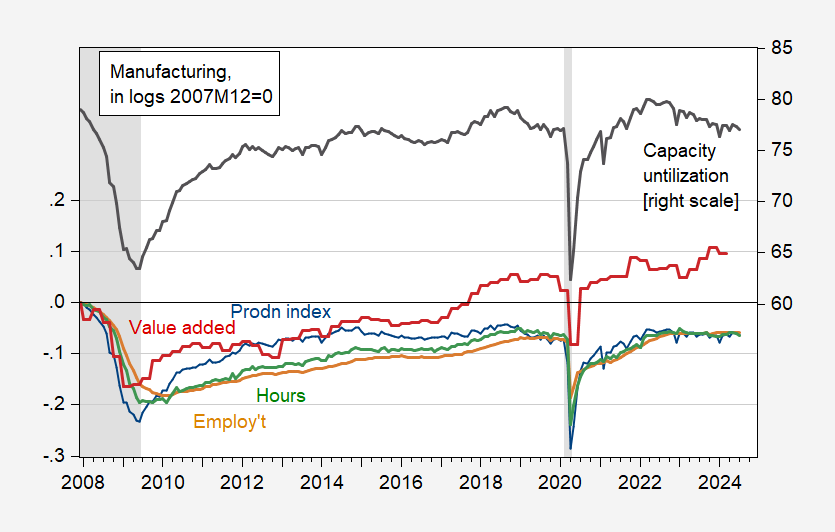
Figure 1: Manufacturing production (blue, left scale), employment (brown, left scale), total hours (green, left scale), real value added (red), all logarithmic, 2007M12=0, manufacturing capacity utilization, % (black, right scale). NBER-defined peak-trough recession dates are in gray. Note: 2007M12 is the NBER business cycle peak. Source: Federal Reserve, BLS, BEA via FRED, NBER.
The figure highlights two facts: (1) Manufacturing production (the Fed index) and value added are different, since the former is gross production and the latter is net production; and (2) employment and hours worked are problematic indicators of manufacturing productivity because manufacturing productivity is higher than the overall economy.
Although facility utilization has declined, it is still above pre-pandemic levels.
Because it is difficult to understand what is happening these days, we present the corresponding post-pandemic data in Figure 2.
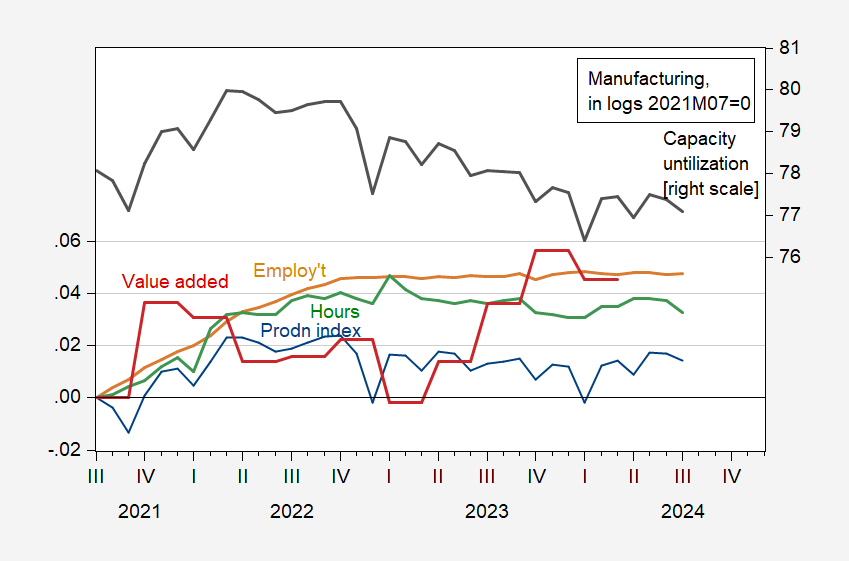
Figure 2: Manufacturing production (blue, left scale), employment (brown, left scale), total hours worked (green, left scale), real value added (red), all logarithmic, 2021M07=0, manufacturing capacity utilization (%), black, right scale. Source: Federal Reserve, BLS, BEA via FRED.
There was no value added in the second quarter, but there was manufacturing production and employment through July. The preliminary figures show a slowdown, but it is not clear whether we are in recession territory (whatever the sectoral recession is).

")
