


With the release of the Philadelphia Federal Reserve’s initial benchmarks, the 12-month change in employment (000’s) from various sources is as follows:
Early benchmarks from the Philadelphia Federal Reserve showed an increase of only 2.4 million people from April 2023 to April 2024, rather than the 2.8 million reported by CES.
Figure 1: Nonfarm payroll employment in CES (blue), QCEW (light blue) adjusted by geometric moving average by author, business employment dynamics (pink), and Philadelphia Fed initial benchmark (light green), all in logarithms, 2023M05=0. The Philadelphia Fed Series is the official CES adjusted by the initial benchmark state total ratio and the CES state total ratio. Sources: BLS via FRED, BLS, QCEW/BLS, BED/BLS; Philadelphia Fed And the author’s calculations.
Therefore, the Philadelphia Fed’s actions mean that NFP employment growth will decline by about 400,000 compared to official employment growth. Does it change our view of the trajectory of employment action? Figure 2 shows the relevant series in log. In May 2023.
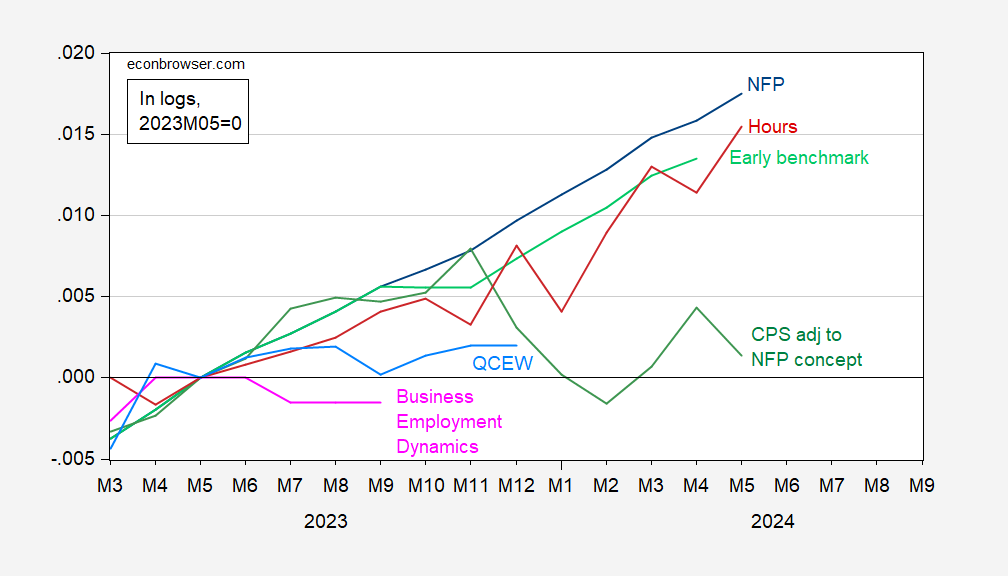
Figure 2: Nonfarm payroll employment for CES (blue), CES hours (red), QCEW adjusted by geometric moving average by author (light blue), business employment dynamics (pink), and Philadelphia Fed initial benchmark (light green), all in logarithms. , 2023M05 =0. The Philadelphia Fed Series is the official CES adjusted by the initial benchmark state total ratio and the CES state total ratio. Sources: BLS via FRED, BLS, QCEW/BLS, BED/BLS; Philadelphia Fed And the author’s calculations.
So, instead of an increase of 1.58% between April 2024 and May 2023, using the Philadelphia Fed measure that includes QCEW information, NFP is up 1.35%.
However, the CPS series adapted to the CES NFP concept should be viewed with particular caution given that it is based on a private employment series that includes new population controls.
The actual employment trajectory is therefore likely to have been depressed relative to the formula, which would not be enough to cause a recession but probably enough to strengthen the case for easing monetary policy.


