


 Drive Stats Revealed")
Starting the game off strong or vice versa can quickly change the way the game plays out. Today I wanted to look at and provide data context on how offensive coordinator Arthur Smith’s teams have fared under his previous coaching (since 2019). We’ll examine the same data for the Pittsburgh Steelers, a team that has struggled to open a game in recent memory. The goal is to see what we can expect for the 2024 season.
To start, here are the average number of plays and yards per drive per game:
Among the teams we’re focusing on, Smith’s 2022 season as head coach of the Falcons was the only one in five years to be above average for both data points (out of 160 qualifiers).
Their average number of plays was 7.9, tied for 12th in that period and third in the 2022 season. A little more subtly than average, his yardage average was 38.2, tied for 63rd overall and 14th on the year.
Many believe Smith has his best season with the Falcons in 2022, and his opening drive was consistent with that notion.
Tennessee’s stronger season in which Smith was the OC was his last in 2020. They did particularly well in yardage average with 42.5, tied for 29th overall and sixth on the season. This occurred at a below-average number of plays (5.9), which unfortunately applies to most teams we watch.
Another above-average performance for Smith came the following year (2021), his first as Atlanta coach, when he averaged 7.1 plays, tied for 41st overall and 9th on the year.
Smith’s remaining units were below average for both data points. This included his most recent 2023 season in Atlanta and, surprisingly, his first year as OC with the 2019 Titans. So out of the five squads he commanded, three performed above average.
Pittsburgh had only one. That’s the 2022 season when the Steelers tied for the most plays on an opening drive with 7.7. This tied for 17th overall and 5th on the year, which was better than I expected.
Otherwise, Pittsburgh has been a below-average team in average plays and yards since 2019. They performed particularly poorly that season, posting bottom-of-the-line results with an injury-riddled QB room. Overall, they rank in the bottom five in each statistic, and their absolute worst average of 11.4 yards per yard is about 5 yards less than any other team in that range.
That includes last season, when Pittsburgh averaged 5.2 per play (31st in 2023) and 27.4 yards (26th). QB Kenny Pickett’s clear regression in his second season coincides with Pittsburgh’s progress.
For comparison, here’s how the new Steelers QB fared with his former team in 2023:
Russell Wilson (Broncos 2023): 6.5 plays (18th), 36.2 yards (13th)
Justin Fields (Bears 2023): 6.4 plays (T-19th), 39.2 yards (10th).
The new QB room has had more success than Pittsburgh had with Smith in that span (including last season), leading to optimism for 2024.
Next, let’s take a closer look at the results of these drives through scoring and turnover percentage.
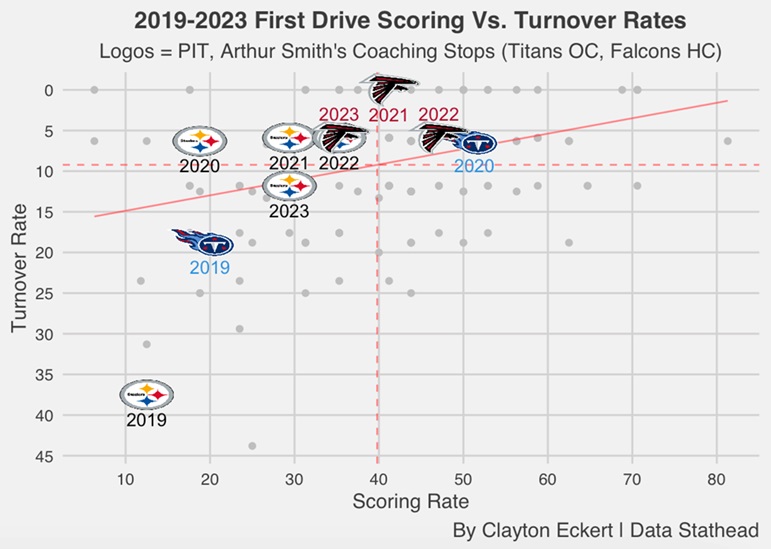
Once again, we see that Smith’s unit performed better overall during that period. Three of his teams have ranked first among teams in focus in scoring percentage results, most notably Tennessee in 2020 and the Falcons in 2022.
Those Titans teams have scored on 50% of their first drives, eight of 16 in 2020. This included seven touchdowns and one field goal, contributing to an 11-5 record, the best of Smith’s time there.
Additionally, the blocking rate was 1, which was above average (6.3%). Of the 10 teams we watch, 7 are above average in this respect. Four of Smith’s previous units (2020 Titans, each Falcons team) and three Steelers teams (2020-2022).
The 2022 Falcons also had a 47.1 scoring percentage (5 touchdowns, 3 field goals), which was above average in both categories. They only had one turnover (an interception), which ranked them tied for 8th with a turnover rate of 5.9. So there is a definite mark.
Atlanta had an impressive zero turnovers on its opening drive in 2021, and comparing that to a 41.2 scoring percentage highlights more specifics about Smith’s stronger results that could lead to Pittsburgh.
Last season, Smith’s Falcons were below average at 35.3 ppg, tied for 18th in 2023, and were above average in turnover percentage (5.9), tied for 10th (first interception). The scoring results make some sense due to regression in quarterback play, but are nonetheless noteworthy as they anticipate what the 2024 Steelers will look like.
The abundance of changes at quarterback is obviously a big factor in Pittsburgh as well. Here’s how the new room performed last season:
Russell Wilson (Broncos 2023): Scoring rate 52.9 (T-5th), turnover rate 11.8 (T-20th).
Justin Fields (Bears 2023): Scoring rate (T-11th) 41.2, turnover rate (T-first) 0.0.
Wilson contributed heavily to the opening drive score. This is exactly what you want to hear from a projected starting pitcher heading into 2024. To be exact, he has 6 touchdowns and 3 field goals. Fields and Chicago also performed well last season, but what was even more impressive was that they had zero turnovers.
In the case of Pittsburgh, I think the turnover rate mentioned above is generally strong. But as you might expect, their scoring rate has been below average in every season for five years. This highlights another change needed for the Steelers’ offense, a recurring theme that Smith and company can address.
The best balance of the two data points was in 2022, with a turnover rate above 5.9 on average (T-7th that year). Pittsburgh’s 35.3 scoring average is tied for 19th on the season and its best since 2019. The room for optimism is the positive trends over the past three years for Pittsburgh, so much data points to a better 2024 on the opening drive.
Going deeper, here are the percentages that scale up offensive production (field goals eliminated), touchdowns, and offensive turnovers (interceptions and fumbles):
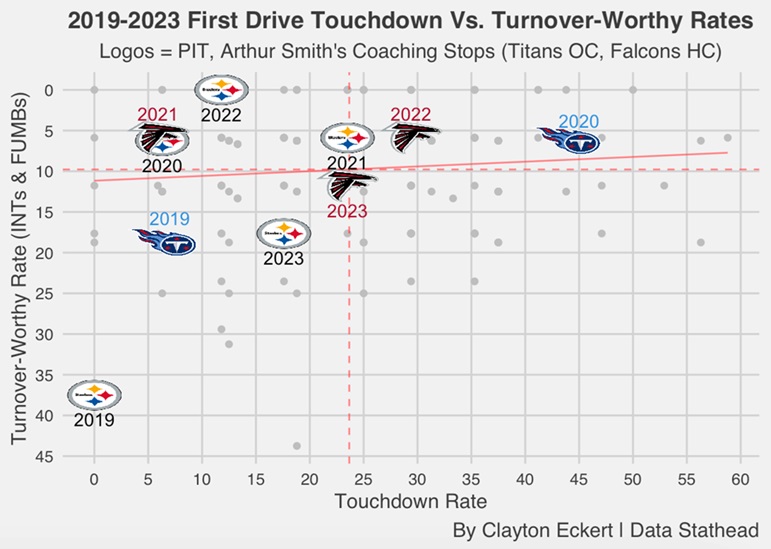
Here we can get a clearer picture of what crimes have been committed in recent history. The 2020 Titans and 2022 Falcons remain the only teams concentrated above average in each statistic. The 43.8% mark on opening drives for those Tennessee units was tied for third-most in 2020 and ninth-most among all eligible teams. Smith’s return to form in his final season at OC will feel magical compared to Pittsburgh’s recent offerings.
This group was comfortably higher than all other focused teams, with Atlanta in 2022 being the second most focused team at 29.4%, tied for 8th that season, but definitely lower than the aforementioned Titans team.
Pittsburgh still had an above-average turnover rate from 2020 to 2021, just as it did in the previous example, and its touchdown rate was also significantly below average. As mentioned earlier, the seven focus teams had above-average turnover rates. Looking at turnover rate, the Falcons last season remained sluggish, falling slightly below the league average (11.8%, tied for 17th) since 2019.
So we saw improvement in Smith’s two years as an OC in Tennessee and then his two years in Atlanta, but he regressed in both statistics last season. This makes sense, but it’s not limited to QB struggles.
Pittsburgh’s touchdown percentage was 17.6 (T-19th) and turnover percentage was 17.6 (T-27th). With how well the Steelers typically take care of the football, their opening drive was problematic (2 interceptions, 1 fumble), which is expected to be a positive trend in 2024.
2019 was not a good year for a focused team, especially the Steelers as expected. 0.0 Touchdown Percentage – wow – And they had a 37.5 turnover percentage (four interceptions, two fumbles), the second-worst among qualifiers. Thank goodness those painful memories are behind us.
This was also the worst result for Smith, who was below average in both statistics. It is important to note that although 2019 was his first coaching season, he is still building his resume with a talented unit. Their 6.3 touchdown percentage and 18.8 turnover percentage rank them tied for 27th and 25th. Stronger results over the next four seasons have led to an optimistic outlook for 2024.
On the other side of the coin, let’s take a quick look at an opening drive that ends with a jump on offense and a kick (field goal or punt). We classified lower numbers as good because an offensive touchdown is the end goal.
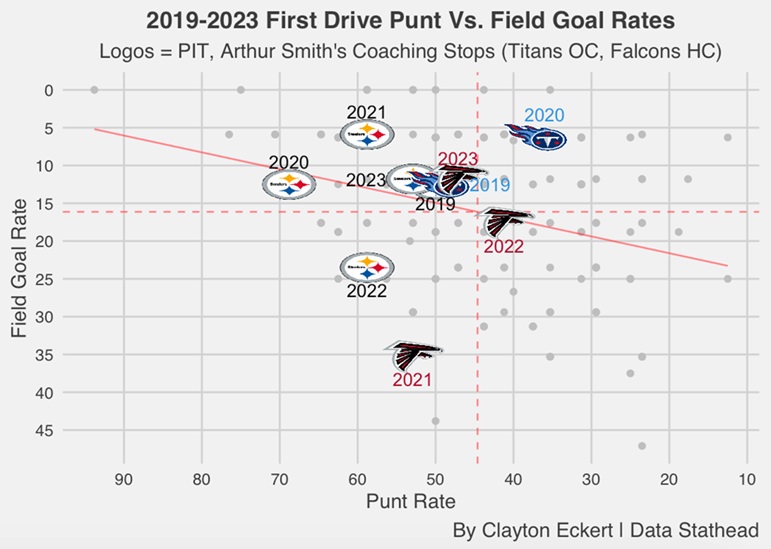
If the offense fails on the opening drive, a field goal or punt obviously makes a big difference. We can see that punt percentage is another aspect of Smith’s play that favors his team. Pittsburgh has been below league average in all five seasons.
The 2020 Titans and 2022 Falcons were above average in limiting punts on their opening drives, adding context to their previous strong marks. The seven teams in focus have limited field goal percentages with the exception of the 2021-22 Falcons and 2022 Steelers.
do not misunderstand. A strong kicker like the Steelers Chris Boswell is very important. But we see that too often those teams have had to score three points on their opening drives.
Both Pittsburgh and Atlanta had limited field goal percentages last season, especially when they had to punt on about half of their opportunities. The Falcons were slightly better with a 47.1 punt percentage (T-15th) compared to the Steelers’ 52.9 (T-22nd in 2023).
To wrap things up, here’s a table with all the statistical rankings (by season) compiled for the study:
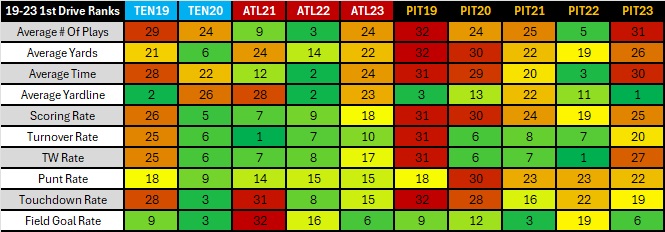
This table provides a good summary of each team’s strengths and weaknesses. Smith fared better than Pittsburgh in the period overall, which provides an optimistic outlook for 2024. But I expect Smith’s regression from last season will put those issues on the priority list with Pittsburgh to address this season.


